• Chart
  • Summary
  • Analysis
  • News
  • Overview

“Gold is money. Everything else is credit.”

J.P. Morgan

“Gold is money. Everything else is credit.”

J.P. Morgan

Search

Straight To The Top.

Copyright © 2025 Mckvay. All rights reserved.
Terms And Conditions
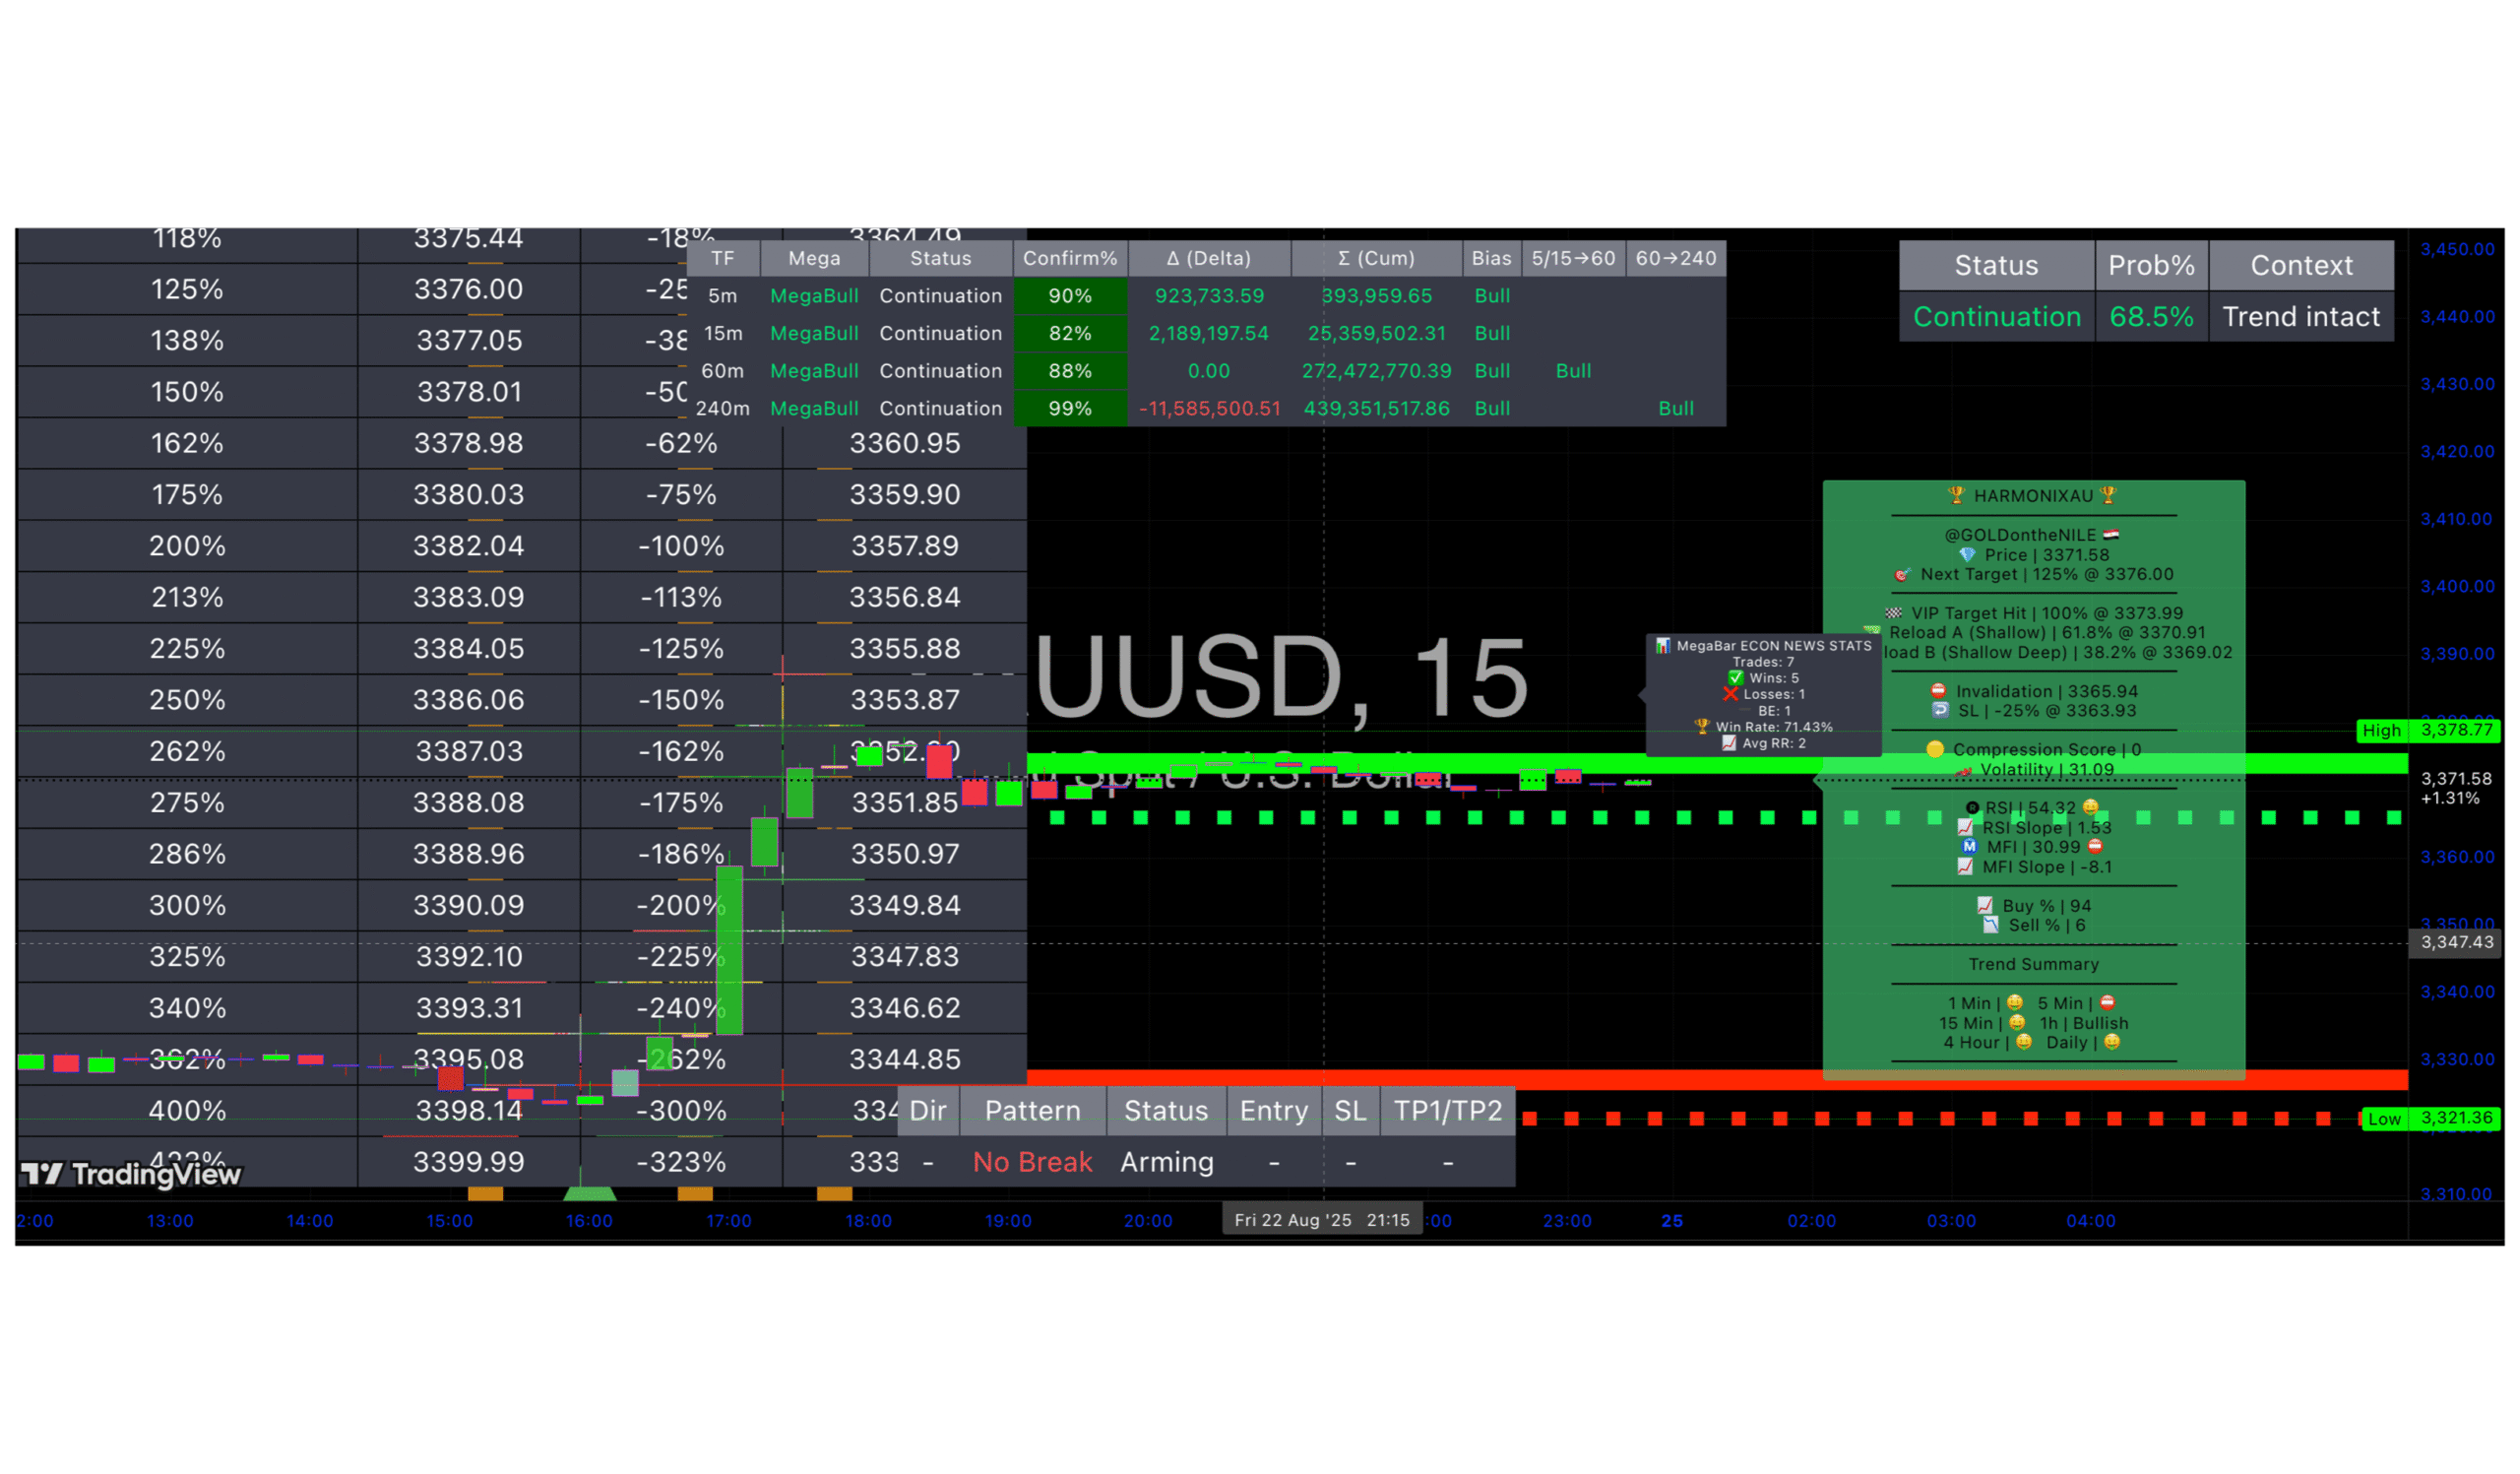
Gold Weekly Market Summary – Week Ending May 30, 2025
Daily Prices (Spot & Futures):
  • Mon May 26: Spot ~$3,332.04 (−0.8% on day); June futures $3,331.90 (−1.0%). (U.S. markets closed for Memorial Day.)
  • Tue May 27: Spot ~$3,302.10 (−1.2%); July futures $3,300.40 (−1.9%).
  • Wed May 28: Spot ~$3,299.95 (~flat); Aug futures $3,294.90 (−0.2%).
  • Thu May 29: Spot ~$3,318.69 (+0.9%); Dec futures $3,343.90 (+0.6%).
  • Fri May 30: Spot ~$3,293.59 (−0.7%); Dec futures $3,315.40 (−0.9%).

Over the week, spot traded between ~$3,332 (Mon high) and ~$3,294 (Fri close), while futures ranged ~$3,344 (Thu high) to ~$3,295 (Wed low). Friday’s close: spot ~$3,294 and futures ~$3,315. Overall futures lost ~US$71 (−2.1%) on the week.

Technical Analysis:
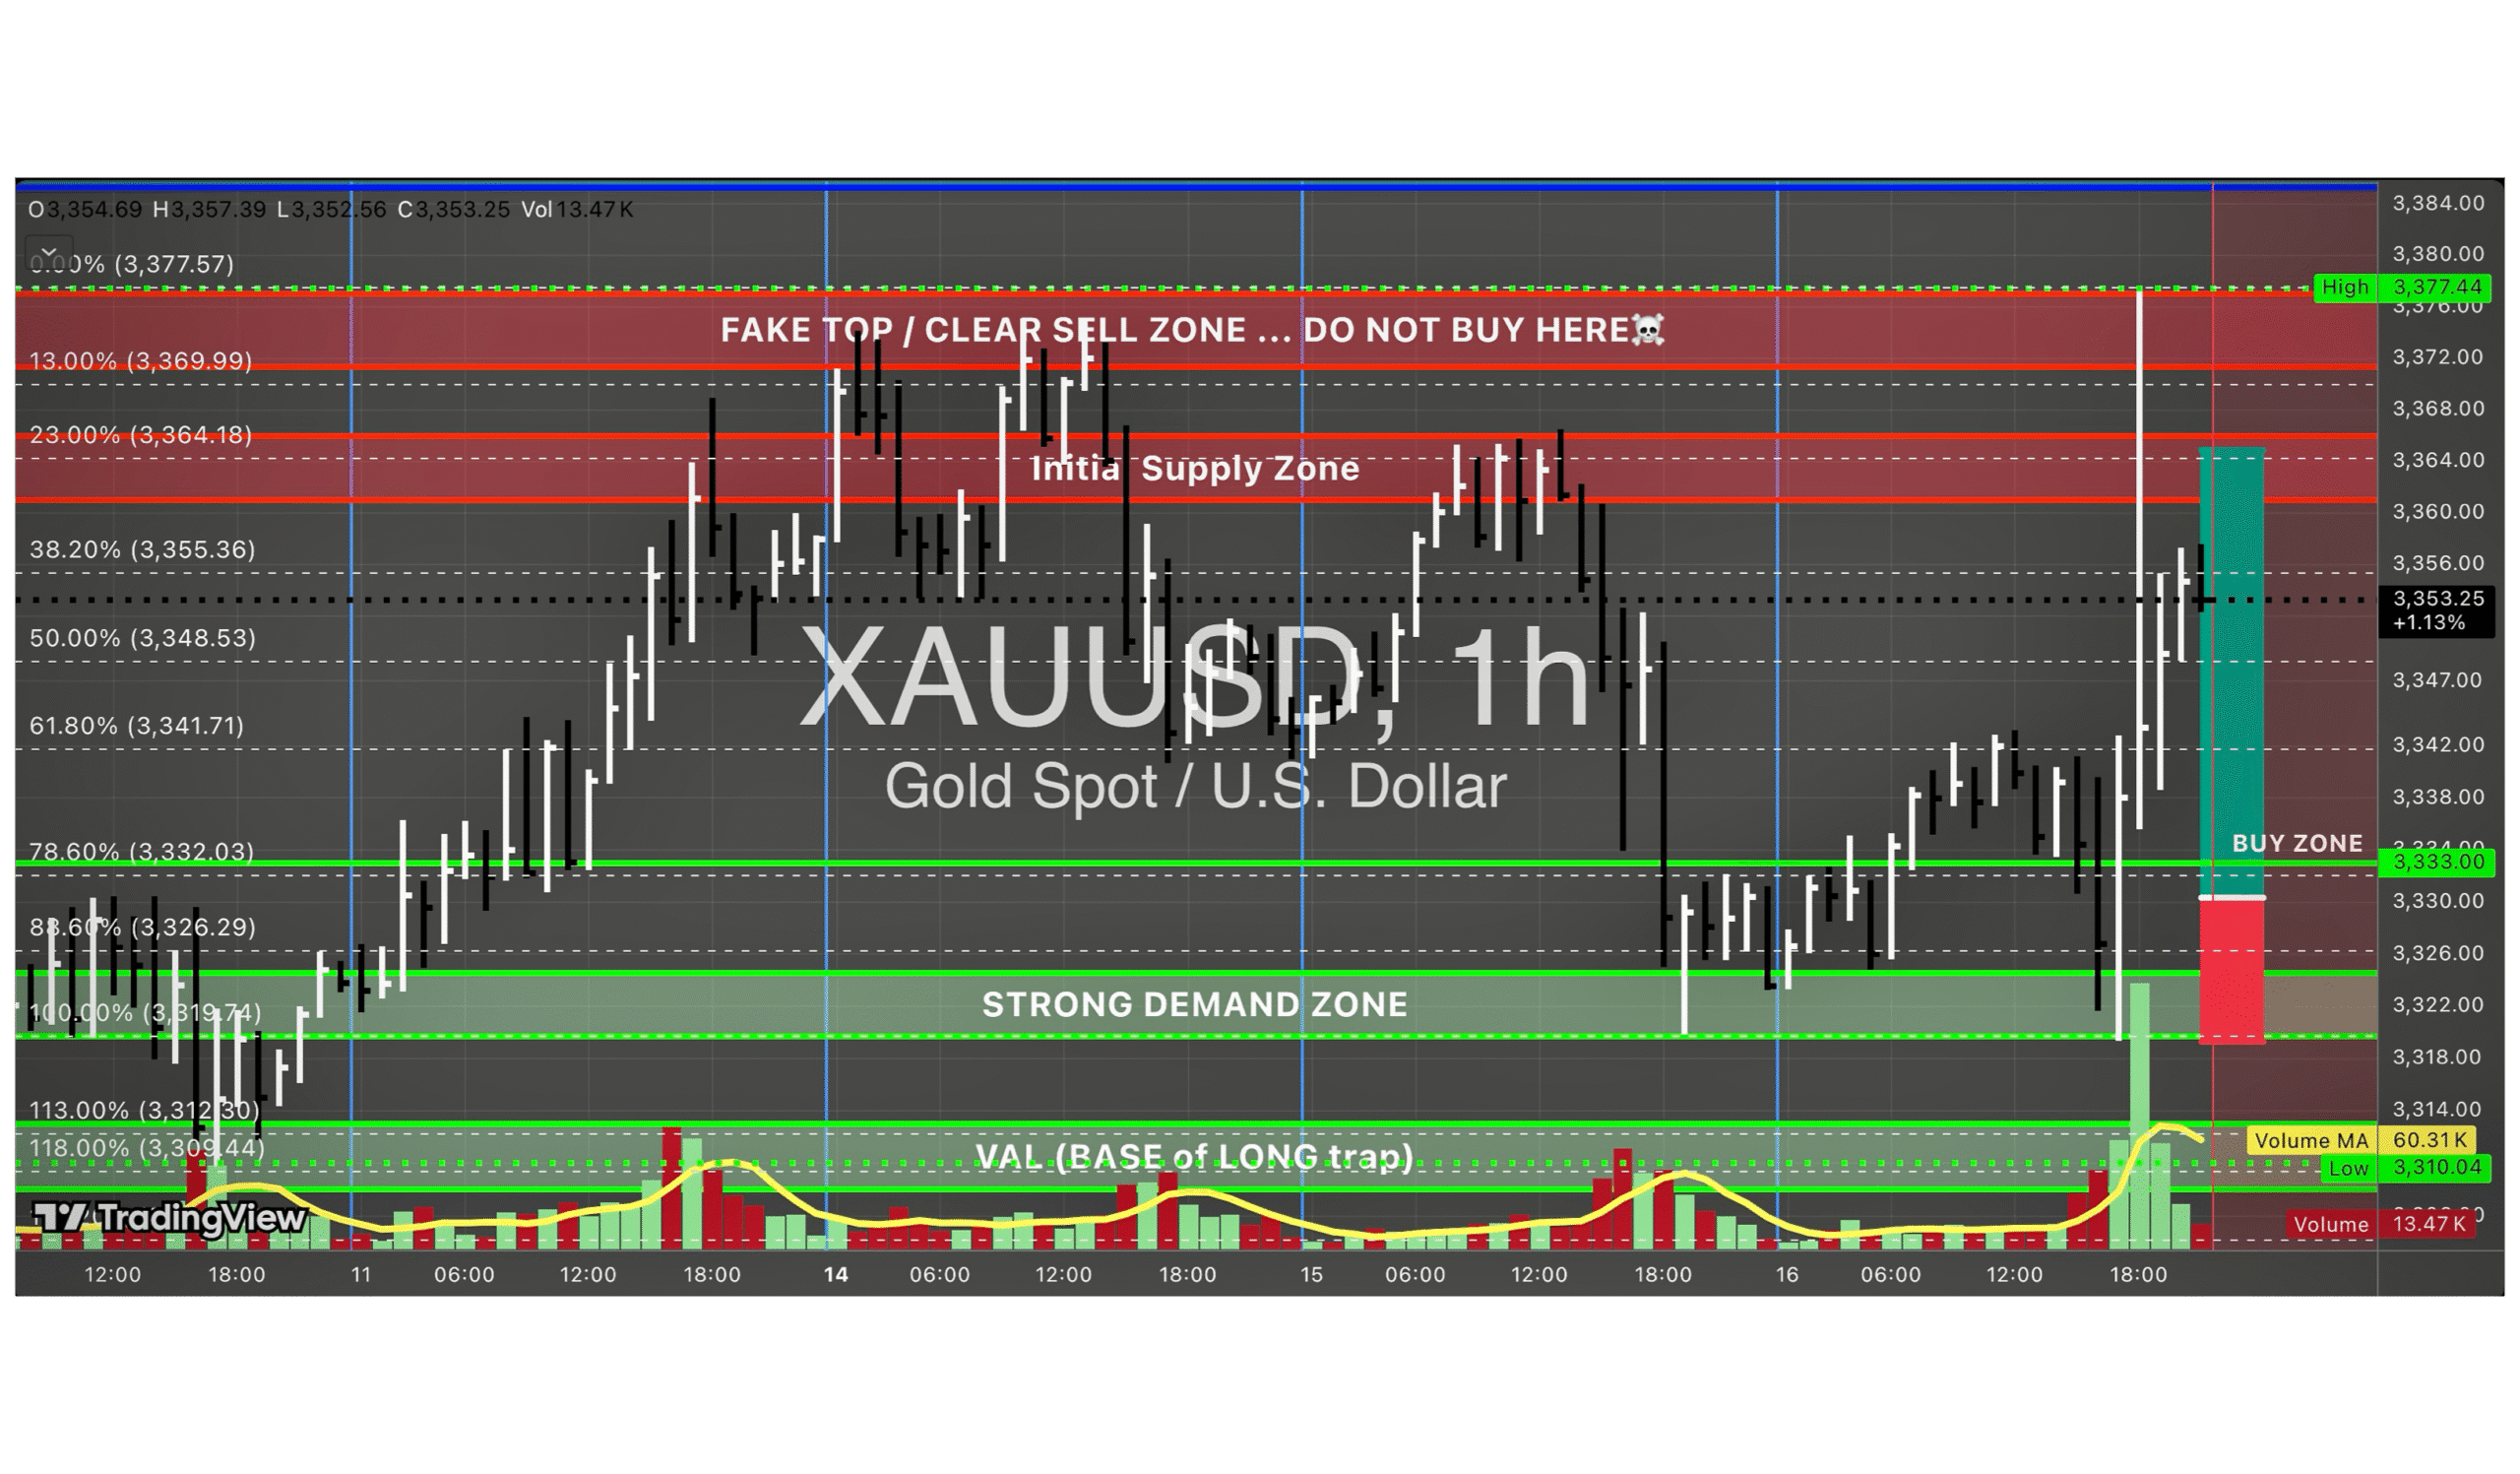
  • Gold is consolidating near key moving averages. It has reclaimed the 21-day SMA around $3,292/oz, which now acts as support.
  • Immediate support: $3,250–$3,280. Resistance: $3,330–$3,350 (then ~$3,400).
  • 14-day RSI ≈ 52 (just above neutral), indicating no extreme overbought/oversold conditions.
  • Recent candlestick patterns (doji formations) suggest market indecision after April’s rally.
  • Technical indicators imply a near-term trading range with a slight bullish bias as long as $3,292 holds.
Macroeconomic & Geopolitical Drivers:
  • Inflation & Fed: U.S. Core PCE rose 2.1% YoY (Apr, below forecast). Fed minutes flagged rising inflation and unemployment risks. Minneapolis Fed’s Kashkari: rates should stay on hold until tariff-inflation effects clear. Mixed data leave markets divided—favorable backdrop for gold as an inflation hedge.
  • Trade & Tariffs: U.S. postponed planned EU tariffs to July, easing safe-haven demand early in the week. A trade court blocked most Trump-era tariffs, but an appeals court reinstated them pending appeal—pushing gold higher on Thursday when the block was removed.
  • Global Risks: Ongoing U.S.-China tensions and Middle East uncertainties underpin safe-haven flows into gold. A weaker U.S. dollar (down ~0.1% Monday) lifted gold, though the dollar firmed modestly (+0.1%) by Friday. European public-debt concerns (Moody’s downgrade) also support gold indirectly.
Global & Regional Developments:
  • India: Demand cooled as local prices hit highs. Dealers offered ~$31/oz discounts on domestic stock (down from $49), reflecting muted late-wedding-season buying. Local 10-gram price ~₹94,900 (~$3,600/oz) on Friday. High import taxes (3% GST) and seasonality kept retail demand subdued.
  • China: Strong consumption & investment. Shanghai Gold Exchange withdrawals jumped 27% m/m in April (153 t). Hong Kong imports tripled m/m. Chinese gold ETFs saw record inflows (AUM +57% in April, holdings 203 t). Local premiums widened to $0–$15/oz. China drove ~65% of Asia’s $11 bn ETF inflows in April.
  • Egypt: CBE cut rates twice (100 bps total) by late May, encouraging flows into non-bank assets like gold. Egypt’s foreign reserves rose via gold: holdings value jumped ~$3 bn in Jan–Apr (to $13.63 bn), underscoring gold’s reserve role.
Currency & Bond Markets:
  • U.S. Dollar: DXY was choppy—spiked to ~100.5 on tariff news, closed slightly higher (+0.1%). Firmer dollar made gold costlier for foreign buyers, tempering gains.
  • Asian Currencies: Indian rupee strengthened to ~85.35/USD, lowering local gold prices. Chinese yuan up ~1% YTD, so RMB-priced gold rose ~24% since Jan, making it more attractive to Chinese investors.
  • U.S. Treasuries: 10-year yield near 4.5% late in the week. Higher yields increase the opportunity cost of holding non-yielding gold. Next week’s Fed/inflation data will be key—softer inflation could allow yields to fall, supporting gold.
Analyst & Institutional Commentary:
  • JPMorgan: Forecast average ~$3,675/oz by end-2025 (up from $3,055), >$4,000 by mid-2026—driven by strong investor and central bank demand (~710 t net quarterly) and rising recession odds.
  • Goldman Sachs: On Apr 14, raised end-2025 target from $3,300 to $3,700/oz—citing strong central bank demand and surging ETF inflows (~80 t/month vs. 70 t prior).
  • Citi/UBS: Remain bullish. UBS’s Staunovo expects gold to retest ~$3,500 in coming months. TD Securities’s Melek: market is consolidating off recent highs; buying dips ahead of eventual Fed easing.
  • World Gold Council: Q1 2025 investment flows hit 552 t (+170% YoY); gold-backed ETFs saw 226.5 t inflows in Q1 (vs. 18.7 t in Q4 2024). Despite 21% drop in central bank buying (244 t) and weak jewelry demand, record ETF flows and bar/coin demand kept prices at all-time highs. April ETF inflows ~$11 bn pushed global ETF AUM to $379 bn (Asia led with ~$7.3 bn).
Central Bank & ETF Flows:
  • Central banks remain major gold buyers: Q1 2025 net purchases ~244 t (including Polish & Turkish central banks; CBE bought in Egypt as noted).
  • Gold ETFs saw unprecedented inflows: global ETF assets now exceed $379 bn (5th straight month of inflows). In April alone, ETFs took in ~$11 bn net (Asia ~$7.3 bn; North America ~$4.5 bn). ETF holdings at highest since mid-2022.
Near-Term Outlook:

Gold appears set to trade cautiously next week. U.S. data—especially Friday’s Core PCE release and personal income/consumption—and Fed comments will be main catalysts. If inflation surprises lower, gold could regain upward momentum; otherwise, consolidation may continue.

Technically, $3,292 (21-day SMA) is key support—breaking below could open $3,250 territory. A break above $3,330–$3,350 would signal new highs; slides below ~$3,280 could lead to deeper pullbacks. Most strategists expect a trading range around current levels until clearer signals emerge.

Overall medium-term bias remains bullish: Citi/UBS maintain that gold is in a long-term uptrend and will benefit when Fed cuts arrive. Next week’s market reaction will hinge on whether data/news tilt toward growth/inflation fears or policy tightening.

Sources:Compiled from Reuters market reports & commentary, Kitco & Bloomberg analyses, and research by Goldman Sachs, JPMorgan, and the World Gold Council.
Disclaimer

The information and recommendations provided on this platform are for educational and informational purposes only and should not be considered as personalized investment advice or a solicitation to buy or sell any financial instruments.

1. No Guarantee of Profit:
Trading in financial markets involves substantial risk, and there is no guarantee of profit or protection against losses. Past performance is not indicative of future results.

2. Independent Decision-Making:
All investment decisions are your sole responsibility. You are encouraged to perform your own research and consult with a qualified financial advisor before making any trading decisions.

3. Market Risks:
Financial markets are subject to volatility, economic conditions, and unforeseen factors that may impact your investments.

4. No Liability:
Mckvay Consulting will not be held liable for any losses or damages resulting from reliance on the information provided. Use the recommendations at your own risk.

5. Educational Purpose Only:
The recommendations are intended to provide insight into market trends and strategies, not to serve as actionable investment directives.

By using this platform, you acknowledge that you have read and understood this disclaimer and accept the associated risks of trading. Always trade responsibly and within your financial means.

Sources
  1. Bloomberg Terminal
  2. Reuters
  3. Investopedia
  4. Mckvay
  5. MarketWatch
  6. DailyForex
  7. MacroTrends
  8. Trading Economics
  9. Acuity Knowledge Partners
  10. Longforecast.com
  11. Cboe Global Markets
  12. TradingView
  13. Central Bank Websites
  14. World Gold Council
  15. Refinitiv Eikon

Search

Straight To The Top.

Copyright © 2025 Mckvay. All rights reserved.
Terms And Conditions
Search

Straight To The Top.

Copyright © 2025 Mckvay. All rights reserved.
Terms And Conditions
XAU/USD
OVERVIEW

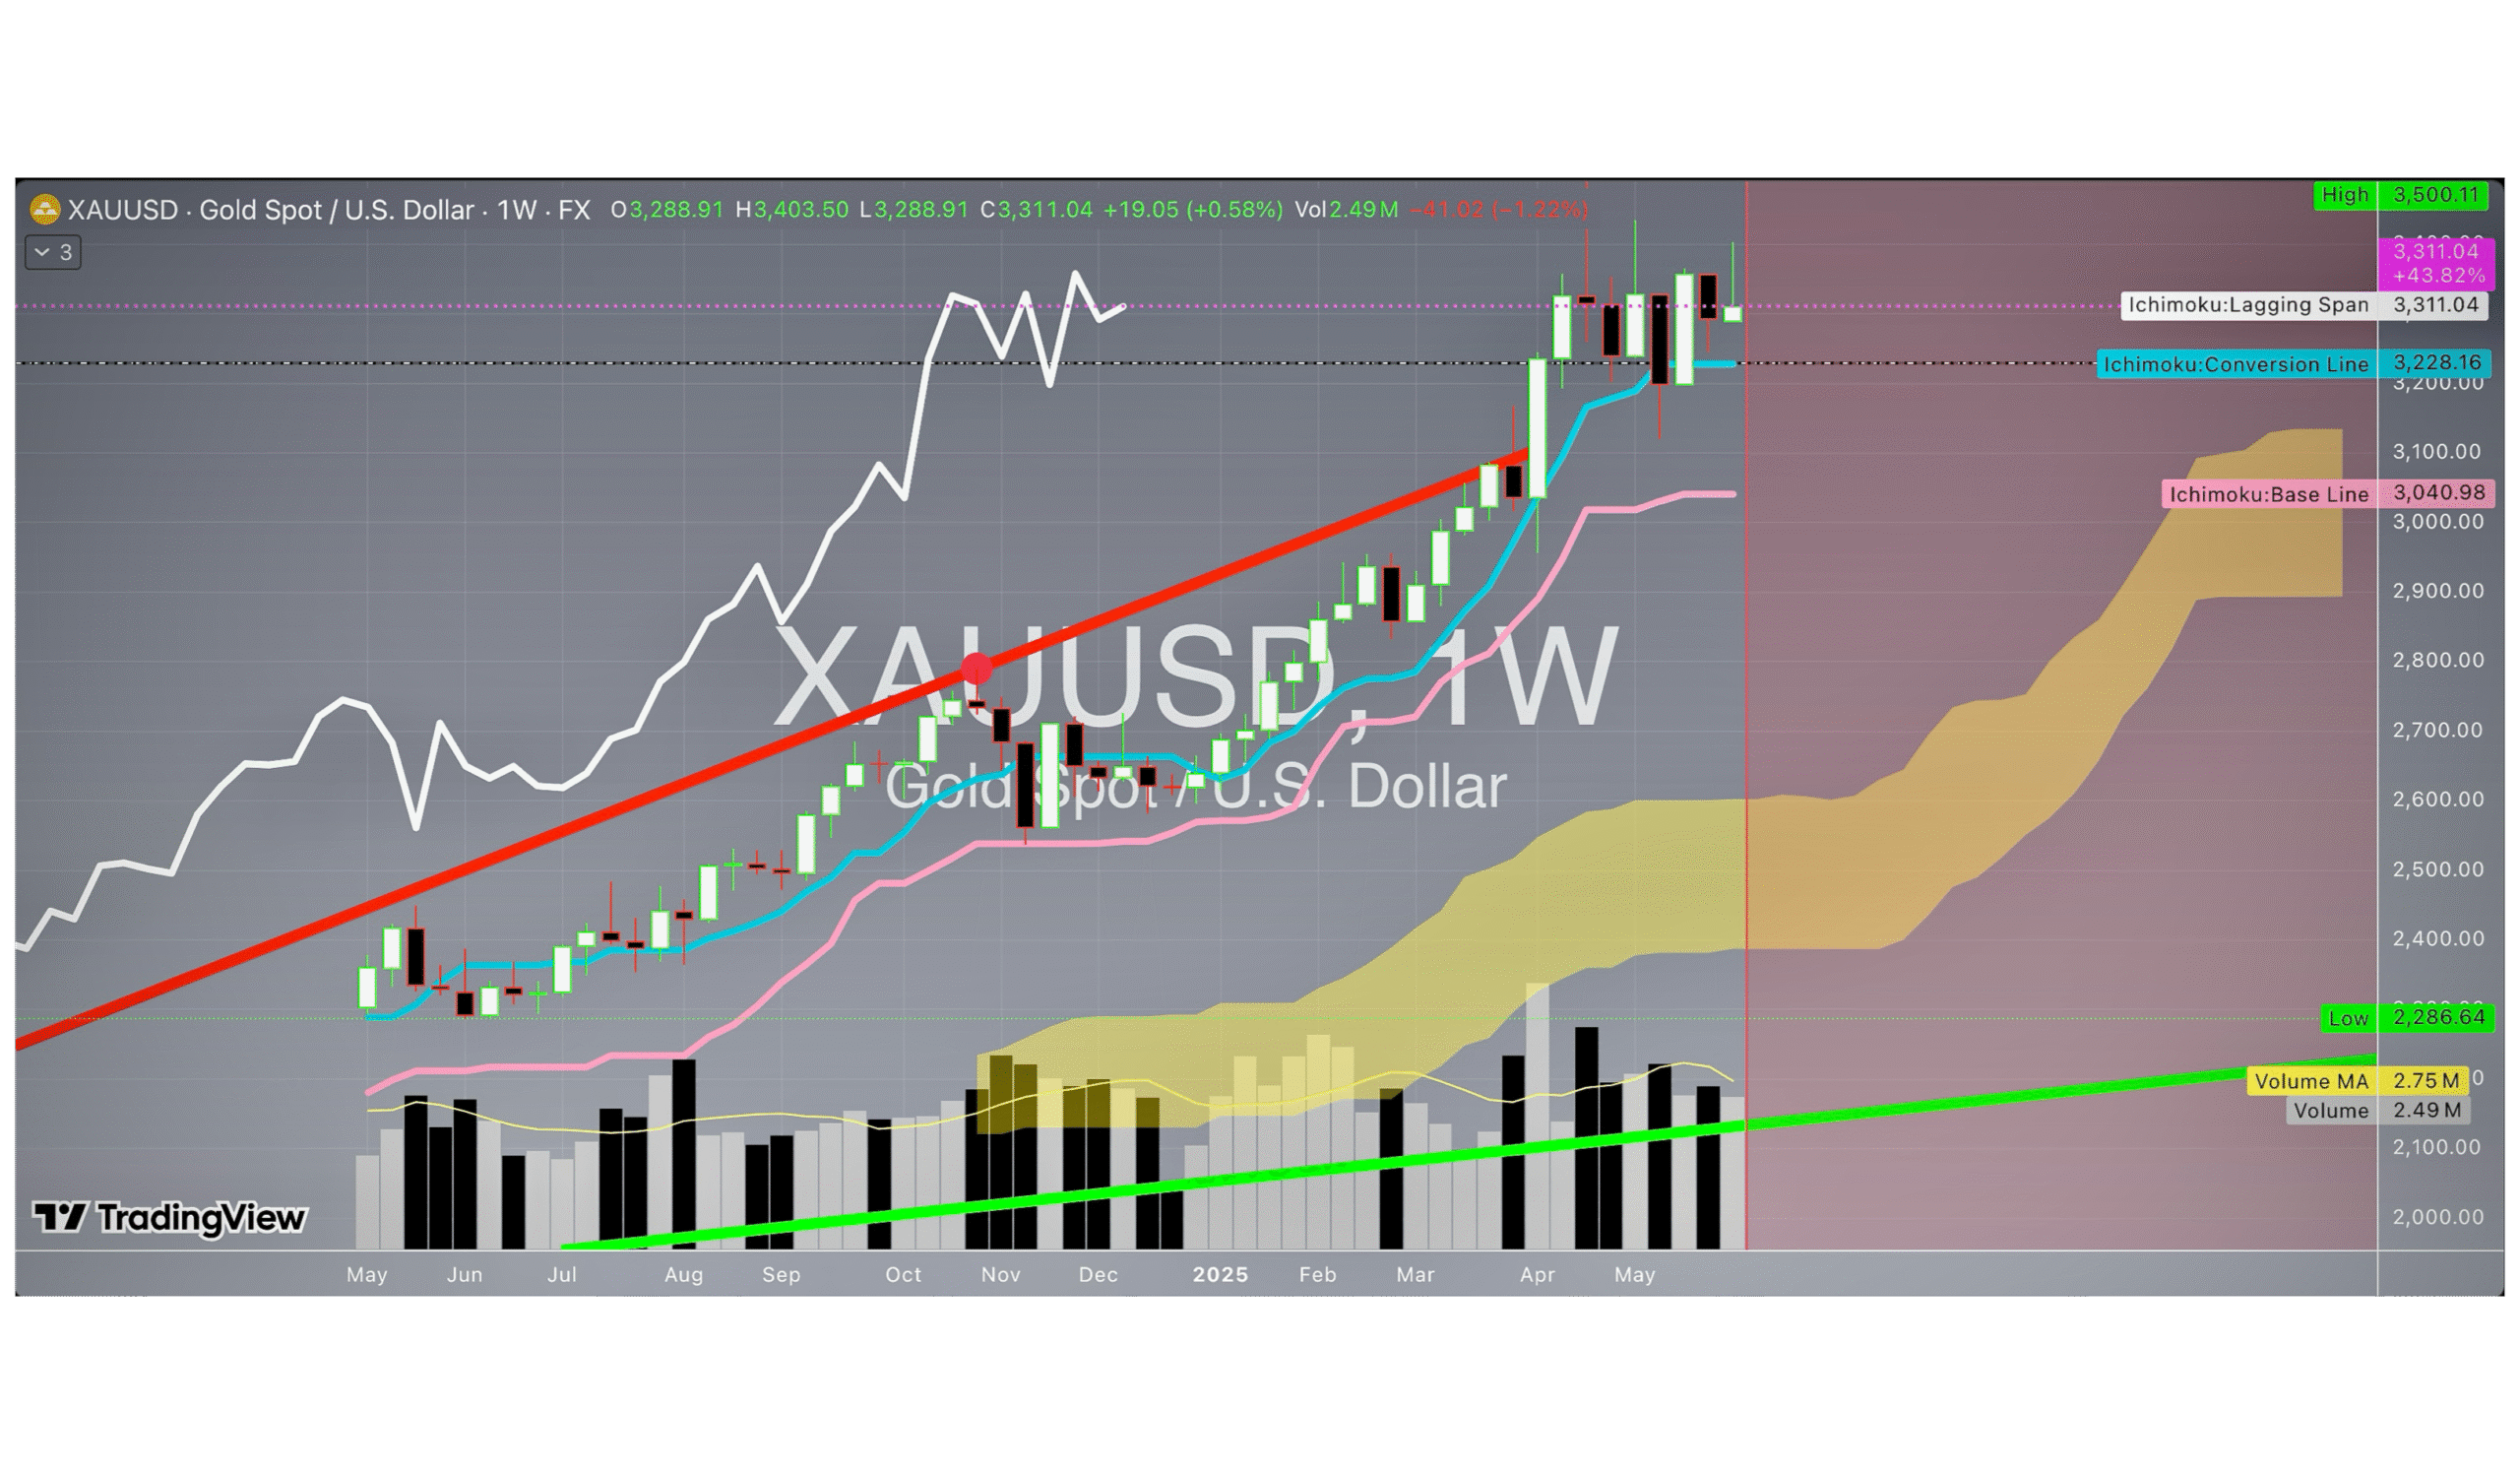
XAU/USD is the trading symbol for Gold priced in US dollars, representing one troy ounce of gold’s value in the global currency market. It is one of the most actively traded commodities, particularly favored during times of economic uncertainty or geopolitical instability. As a safe-haven asset, gold offers investors and traders a hedge against inflation, currency devaluation, and market volatility. The price of XAU/USD is heavily influenced by the strength of the US dollar, as the two generally share an inverse relationship. A strong US dollar often pushes gold prices lower, while a weaker dollar makes gold more attractive to investors, increasing its price. Additionally, interest rates play a significant role; since gold does not yield interest or dividends, higher rates typically reduce its appeal, whereas lower rates can lead to higher demand.

Gold’s price is also impacted by global economic indicators such as inflation rates, GDP growth, and reports like Non-Farm Payrolls and Consumer Price Index (CPI). Central bank policies, particularly those of the Federal Reserve, are closely monitored by traders, as decisions on interest rates and monetary easing can directly influence XAU/USD movements. Furthermore, geopolitical events like wars, political tensions, and pandemics often drive demand for gold as investors seek stability in uncertain times. The global demand for gold, especially from major markets like China and India, further affects prices through its industrial, jewelry, and investment uses.

Trading XAU/USD offers various opportunities, including spot trading, contracts for difference (CFDs), futures, options, and ETFs that track gold prices. Spot trading and CFDs are popular among forex traders for their liquidity and leverage, while futures and ETFs attract longer-term investors. Traders employ a variety of strategies such as trend trading, range trading, and breakout trading, often supported by technical tools like moving averages, RSI, Bollinger Bands, and Fibonacci retracement levels. Fundamental analysis is equally crucial, requiring traders to monitor economic data, Federal Reserve announcements, and global news that could influence gold’s value.

To trade XAU/USD effectively, traders should manage risks carefully by using stop-loss orders and avoiding excessive leverage. Timing is also essential, as gold tends to be most active during the overlap of the London and New York trading sessions. Staying informed about macroeconomic and geopolitical developments is vital, as these factors can trigger significant price movements. With its high liquidity and the unique dynamics between gold and the US dollar, XAU/USD remains a favorite instrument for traders looking to diversify their portfolios and capitalize on the opportunities in the global markets.

MORE INFORMATION

Search

Straight To The Top.

Copyright © 2025 Mckvay. All rights reserved.
Terms And Conditions