2025

XAUUSD Chart 412025 Mckvay April 20, 2025

The XAU/USD (Gold Spot to US Dollar) closed at $2,641.35 per troy ounce

As of January 3, 2025, the XAU/USD (Gold Spot to US Dollar) closed at $2,641.35 per troy ounce, reflecting a decrease of approximately 0.51% from the previous day’s close of $2,654.78. 1. Last Night Close Summary Date January 3, 2025 Closing Price $2,641.35 per troy ounce Daily Change -0.51% (from previous close of $2,654.78) 2. […]

The XAU/USD (Gold Spot to US Dollar) closed at $2,641.35 per troy ounce Read More »

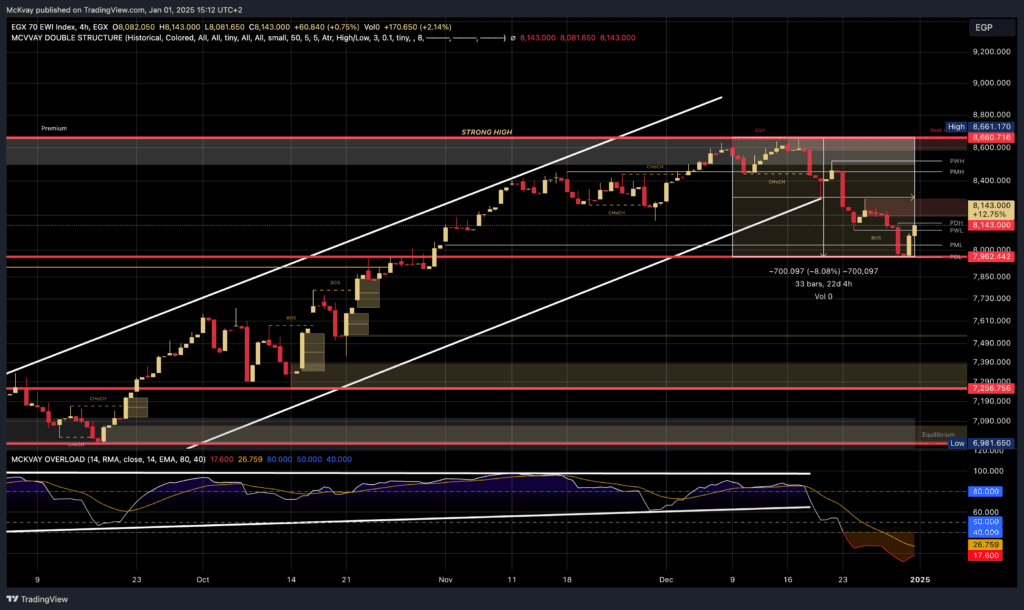
EGX70EWI Chart 112025 Mckvay April 20, 2025

EGX70 Index on a 4-hour timeframe, key price structures, critical support and resistance levels, and momentum insights.

January 1, 2025 1. Overview This chart represents the EGX 70 Index on a 4-hour timeframe. It highlights key price structures, critical support and resistance levels, and momentum insights. The analysis focuses on the current corrective phase following a significant uptrend. 2. Trend Analysis Primary Uptrend: The price followed a strong upward channel, forming higher

EGX70 Index on a 4-hour timeframe, key price structures, critical support and resistance levels, and momentum insights. Read More »

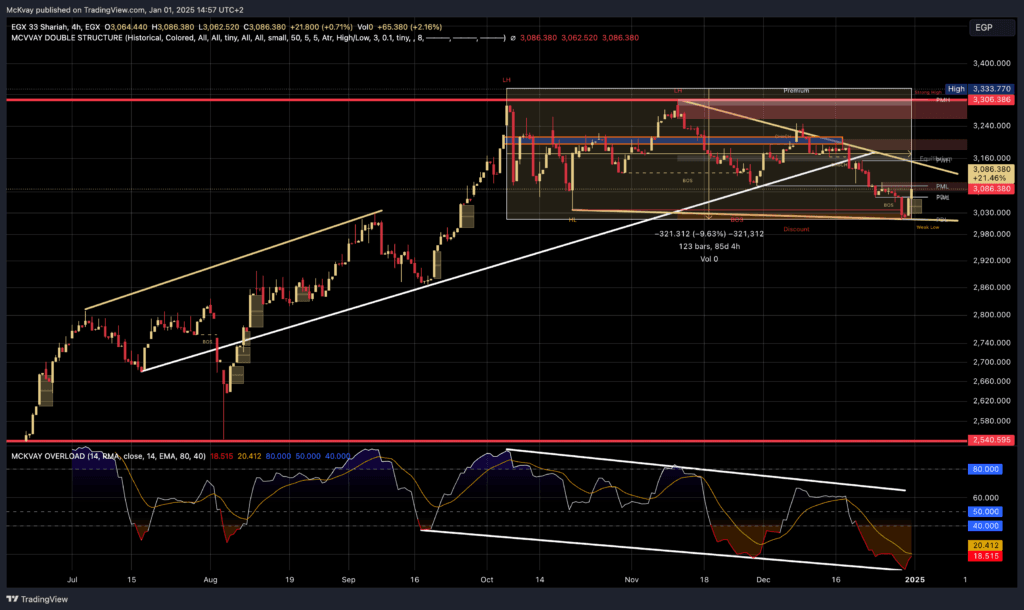
SHARIAH Chart 112025 Mckvay April 20, 2025

EGX 33 Shariah Index on a 4-hour timeframe, significant price action structures, key support and resistance levels, and momentum analysis.

January 1, 2025 1. Overview This chart represents the EGX 33 Shariah Index on a 4-hour timeframe. It includes significant price action structures, key support and resistance levels, and momentum analysis. The analysis reflects a medium-term corrective phase within a broader bullish structure. 2. Trend Analysis Primary Uptrend: The price followed a strong upward channel

EGX 33 Shariah Index on a 4-hour timeframe, significant price action structures, key support and resistance levels, and momentum analysis. Read More »

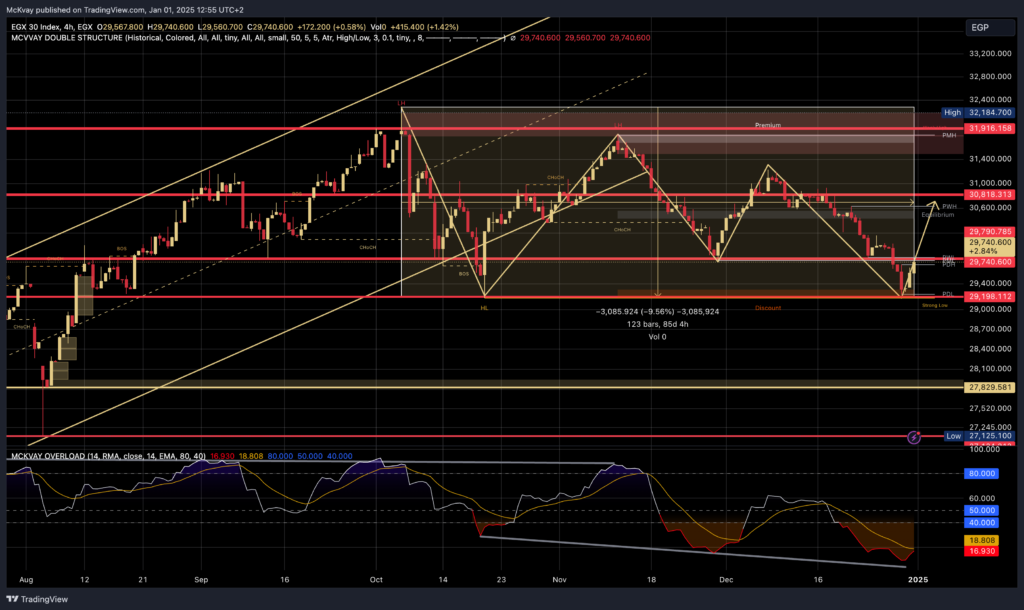
EGX30 Chart 112025 Mckvay April 20, 2025

EGX30 Index on a 4-hour timeframe, emphasizing critical market dynamics, including price trends, key levels, and momentum shifts.

January 1, 2025 1. Overview This analysis focuses on the EGX30 Index on a 4-hour timeframe, emphasizing critical market dynamics, including price trends, key levels, and momentum shifts. This analysis combines previous observations with additional details, highlighting the importance of 30,818 as a key resistance, 29,198 as strong support, and the broader implications of market

EGX30 Index on a 4-hour timeframe, emphasizing critical market dynamics, including price trends, key levels, and momentum shifts. Read More »

Scroll to Top