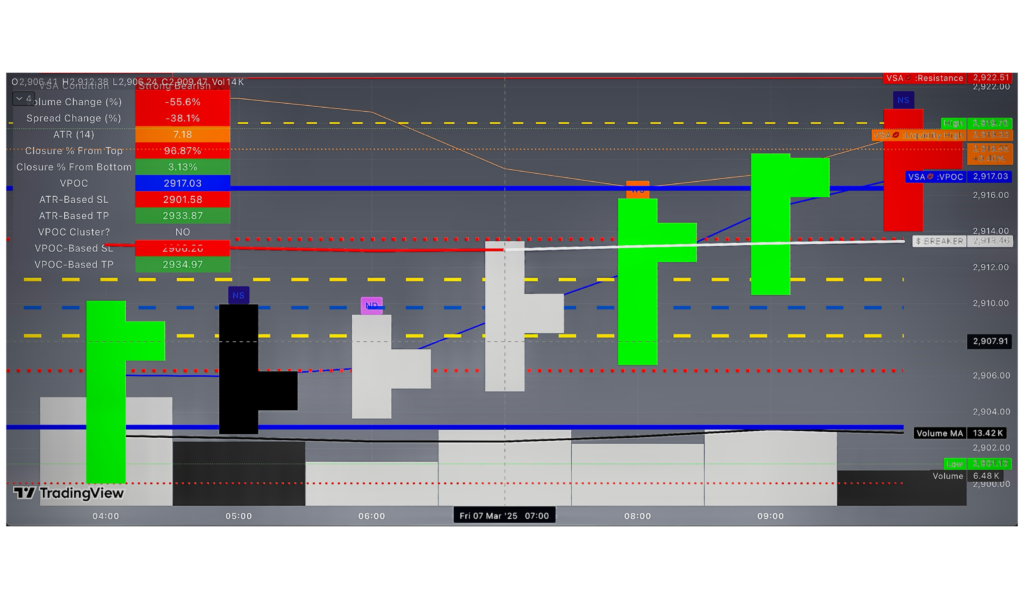
2025

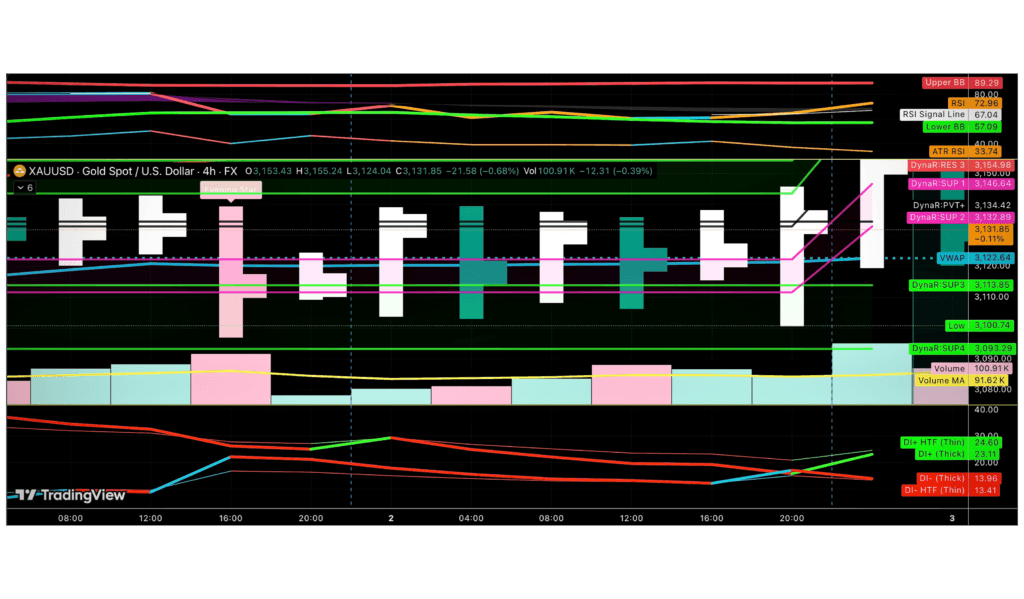
XAUMO GOLD CHART 02/03/2025

XAUMO – XAUUSD (GOLD SPOT) PLATINUM INSTITUTIONAL ANALYSIS

Section Details Session Transition ⚡ Session Transition: End of Week | End of Month | Entering New Trading Month | Pre-London Liquidity Setup SECTION 1: MACRO-LEVEL OUTLOOK 📊 Monthly FVRP & Market Context (February Recap → March Projections) 🔥 February Recap: ✅ Monthly POC: $2,877.26 → Heavy balance area → Price magnet. ✅ Monthly VAH: […]

XAUMO – XAUUSD (GOLD SPOT) PLATINUM INSTITUTIONAL ANALYSIS Read More »

XAUUSD CHART BY MCKVAY

XAUMO (XAU/USD) Platinum Report – The Ultimate Institutional Playbook

Section Details Date Friday, February 28, 2025 Market XAU/USD (Gold) Sessions Asia Session Recap → London Session Live → NYC Ahead Mission Capture Smart Money’s Next Move in Gold Before the Week & Month Close. 1️⃣ Macro & Institutional Drivers – What’s Driving Gold? HIGH-IMPACT EVENTS IN PLAY: Month-End Positioning & Institutional Rebalancing Today is

XAUMO (XAU/USD) Platinum Report – The Ultimate Institutional Playbook Read More »

XAUUSD CHART BY MCKVAY

Impact of yesterday’s Piercing Bar – XAUUSD (Gold/USD 1D Chart)

Section Details Impact of Piercing Bar (Gold/USD 1D Chart) Analysis of yesterday’s price action and today’s bearish continuation. 1. Price Action & Candlestick Pattern Analysis The Piercing Line pattern is a bullish reversal signal that appears after a downtrend. However, today’s strong bearish follow-through (big red candle) invalidates the bullish setup. This indicates weakness in

Impact of yesterday’s Piercing Bar – XAUUSD (Gold/USD 1D Chart) Read More »

XAUUSD CHART - MCKVAY

XAUMO – XAUUSD Daily Strategy Execution & Institutional Trading Report

Section Details Title 📌 XAUMO Daily Strategy Execution & Institutional Trading Report Date 📅 February 24, 2025 Market 📍 XAU/USD (Gold) Objective 🎯 Execute and document XAUMO’s FVRP (Fixed Volume Range Profile) Strategy, integrating POC, VAH, VAL, VWAP, Market Maker Logic, and Advanced VSA. Institutional Volume & Liquidity Analysis 🔹 Point of Control (POC) POC

XAUMO – XAUUSD Daily Strategy Execution & Institutional Trading Report Read More »

XAUUSD CHART BY MCKVAY

XAUMO – XAUUSD Platinum Weekly Market Outlook Feb 26 – Mar 1, 2025

Section Details Title 🚀 XAUMO Platinum Weekly Market Outlook – The Ultimate Institutional Playbook 🚀 Week Feb 26 – Mar 1, 2025 Market XAU/USD (Gold) Objective Identify Institutional Liquidity Moves, Volume Footprint, and Smart Money Activity to Execute High-Precision Trades Macro & Institutional Drivers – What’s Moving Gold Next Week? 1️⃣ FOMC Speeches & USD

XAUMO – XAUUSD Platinum Weekly Market Outlook Feb 26 – Mar 1, 2025 Read More »

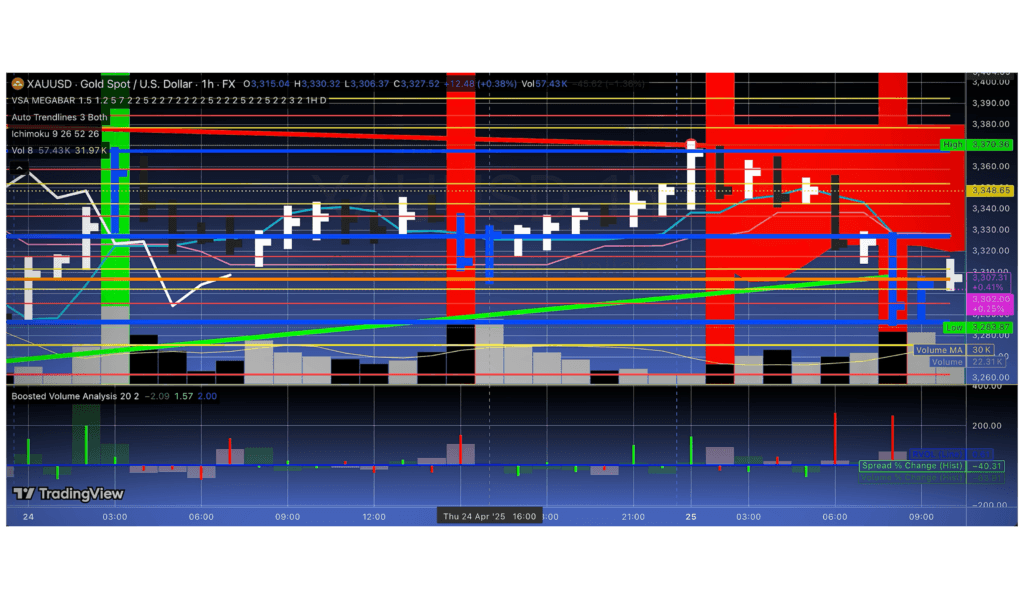
Smart Money Moves Chart Mckvay April 20, 2025

How to Identify Smart Money Moves & Execute High-Probability Trading

Mastering Institutional Liquidity and Volume Footprint Analysis in Gold (XAU/USD) Identifying Institutional Activity and Executing Strategic Trades 1. Introduction: Volume Footprint and Institutional Liquidity Dynamics Why Volume Footprint Matters Volume footprint analysis provides granular insights into buy/sell pressure at specific price levels, offering advantages over traditional candlestick charts: – Identification of institutional order placement and

How to Identify Smart Money Moves & Execute High-Probability Trading Read More »

XAUUSD CHART - MCKVAY

XAUMO WEEKLY REP0RT (week of Jan 25-31) – (xau/usd Roadmap)

XAUMO Institutional Playbook (Redesigned) Scenario 1: Bullish Breakout Above $2,785 (VAH) Market-Maker Logic: Breakout above $2,785 (VAH) signals institutional buying, targeting stops around $2,790-$2,800 (Fibonacci TP Zone). Entry: Buy Stop at $2,786 Take Profit Levels: • $2,790: (Psychological Level & FVG Midpoint) • $2,800: (Fibonacci Extension 161.8%) Stop Loss: $2,771 (POC) Shark Moves: Fake breakouts

XAUMO WEEKLY REP0RT (week of Jan 25-31) – (xau/usd Roadmap) Read More »

XAUUSD April 20, 2025

The XAUUSD closed at $2,770.89 per troy ounce, marking a 0.40% increase from the previous close

As of January 24, 2025, the XAU/USD (Gold Spot to US Dollar) closed at $2,770.89 per troy ounce, marking a 0.40% increase from the previous close. This rise was driven by uncertainty over U.S. President Donald Trump’s tariff plans and his advocacy for lower interest rates, which weakened the dollar. Gold Weekly Analysis (January 24,

The XAUUSD closed at $2,770.89 per troy ounce, marking a 0.40% increase from the previous close Read More »

EGX33 CHART BY MCKVAY

EGX33 (shariah) Index UPDATED on a DAILY timeframe, Key Support & Resistance, AND Price Action & Volume.

EGX33 Shariah Daily Chart – Comprehensive Technical Analysis Date of Analysis January 25, 2025 Confidence Level 8/10 – Based on clear technical signals (market structure, momentum, breakout patterns). Nonetheless, macroeconomic factors or policy changes can impact the index significantly. Market Structure The EGX33 Shariah Index has been in a broad downtrend since October, peaking around

EGX33 (shariah) Index UPDATED on a DAILY timeframe, Key Support & Resistance, AND Price Action & Volume. Read More »

EGX70 EWI CHART BY MCKVAY

EGX70 EWI Index UPDATED on a DAILY timeframe, Short-Term & Medium-Term Outlook, AND Market Structure.

EGX70 EWI Daily Chart – Comprehensive Technical Diagnosis Date of Analysis January 25, 2025 Confidence Level 8/10 – Supported by multiple technical signals (market structure, momentum oscillation, and trading volume). Economic and political developments can still exert a potential influence on the index’s performance. Market Structure The EGX70 EWI is currently trading within a broad

EGX70 EWI Index UPDATED on a DAILY timeframe, Short-Term & Medium-Term Outlook, AND Market Structure. Read More »

Scroll to Top