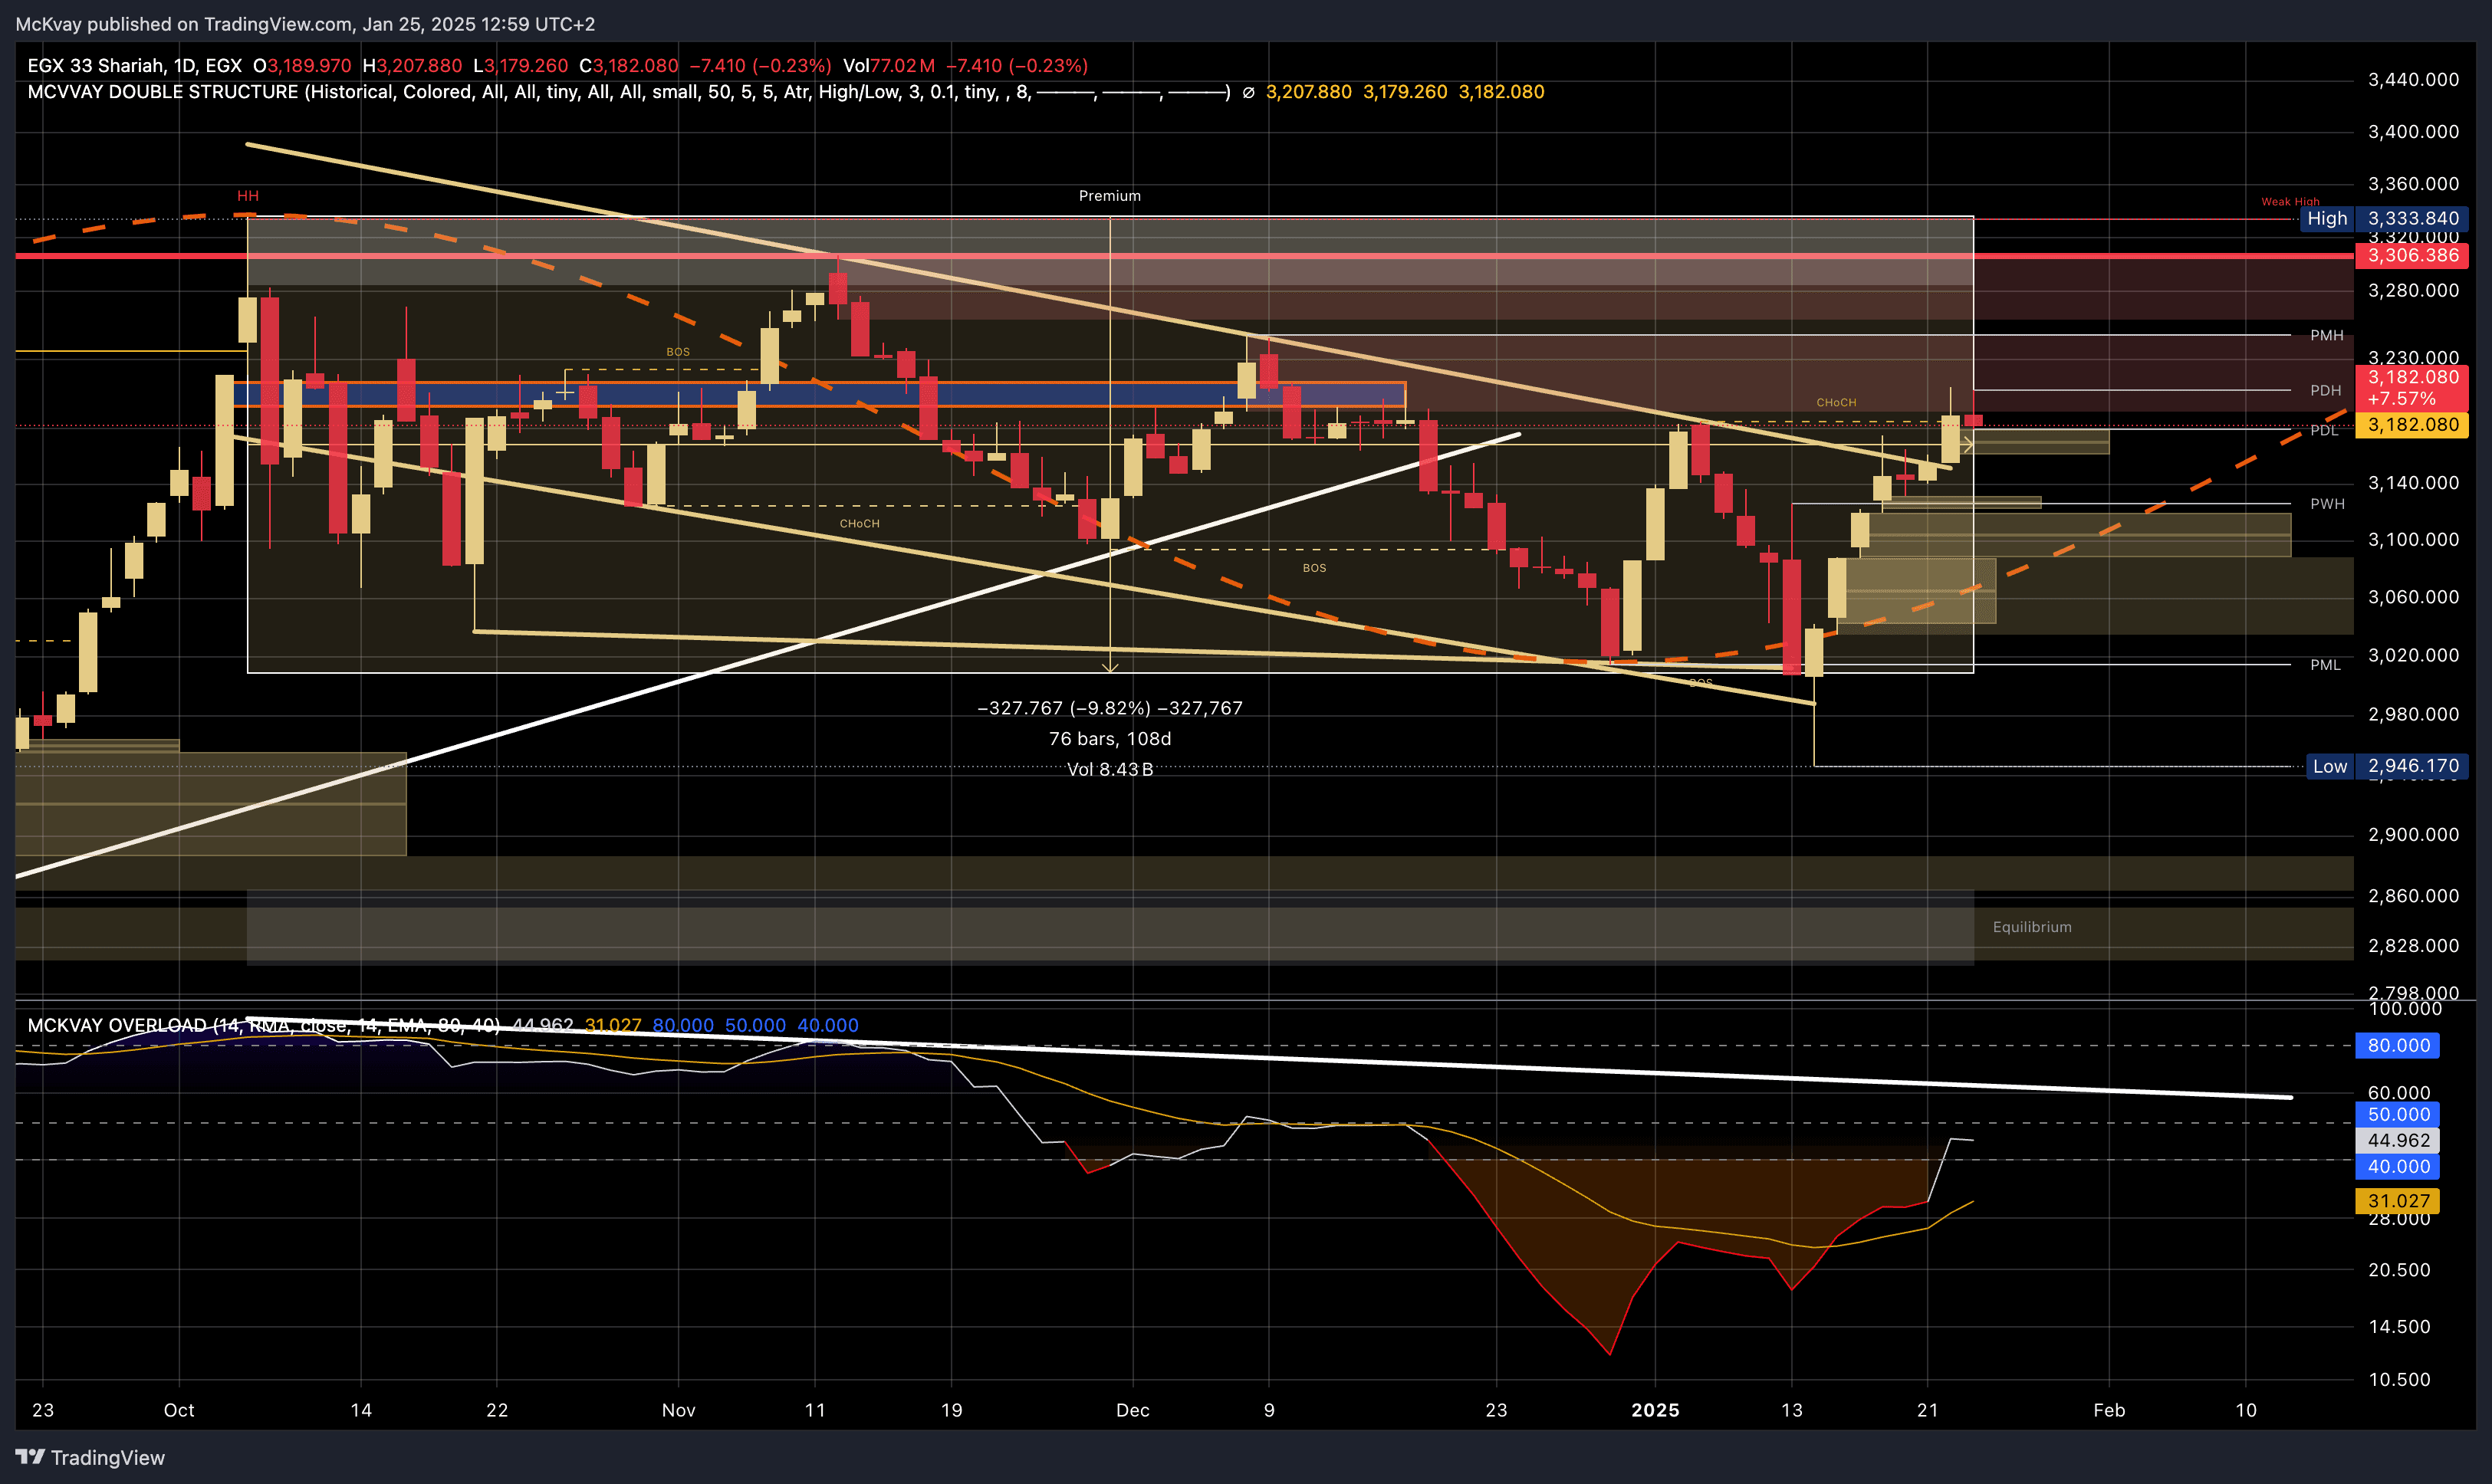
| EGX33 Shariah Daily Chart – Comprehensive Technical Analysis | |||||||||||
|---|---|---|---|---|---|---|---|---|---|---|---|
| Date of Analysis | January 25, 2025 | ||||||||||
| Confidence Level | 8/10 – Based on clear technical signals (market structure, momentum, breakout patterns). Nonetheless, macroeconomic factors or policy changes can impact the index significantly. | ||||||||||
| Market Structure | The EGX33 Shariah Index has been in a broad downtrend since October, peaking around the 3,330–3,380 zone and then dipping to a low near 2,946. Over the past few weeks, a noticeable rebound has formed a potential higher low (Higher Low), hinting at a short-term shift toward bullish momentum. | ||||||||||
| Price Action & Volume |
| ||||||||||
| BOS & CHoCH | A clear Break of Structure (BOS) was identified around 3,040–3,060, while a Change of Character (CHoCH) above 3,100 marked a transition from selling pressure to buyer dominance. A complete trend reversal depends on a sustained move above the 3,180–3,200 range. | ||||||||||
| Momentum | The Mckvay Overload indicator is currently reading around 31, reflecting a move from oversold territory into a neutral zone. Further gains above 40–50 would validate stronger bullish momentum, whereas a drop below 30 suggests renewed selling pressure. | ||||||||||
| Key Support & Resistance |
| ||||||||||
| Outlook |
| ||||||||||
| Risk Management | Placing stop-loss orders below ~3,140 for short-term trades or below 3,000 for medium-term positions is advisable. Traders should also monitor macroeconomic indicators and possible policy shifts, as these can rapidly affect market sentiment and liquidity. | ||||||||||
| Summary & Disclosure |
The EGX33 Shariah Index is showing promising signs of recovery from a recent downtrend. Bullish signals, including BOS and CHoCH, point toward a possible trend shift if price remains above 3,180–3,200. A break beyond 3,280–3,333 could support a larger rally toward 3,400. Conversely, dropping below 3,100 would dampen the short-term bullish case. Disclaimer: This analysis is intended for informational purposes and does not constitute financial advice. Always conduct your own due diligence or consult a certified professional before making any trading or investment decisions. | ||||||||||
| References |
Source Links:
Additional Reading: | ||||||||||
Disclaimer.
The information and recommendations provided on this platform are for educational and informational purposes only and should not be considered as personalized investment advice or a solicitation to buy or sell any financial instruments.
1. No Guarantee of Profit:
Trading in financial markets involves substantial risk, and there is no guarantee of profit or protection against losses. Past performance is not indicative of future results.
2. Independent Decision-Making:
All investment decisions are your sole responsibility. You are encouraged to perform your own research and consult with a qualified financial advisor before making any trading decisions.
3. Market Risks:
Financial markets are subject to volatility, economic conditions, and unforeseen factors that may impact your investments.
4. No Liability:
Mckvay Consulting will not be held liable for any losses or damages resulting from reliance on the information provided. Use the recommendations at your own risk.
5. Educational Purpose Only:
The recommendations are intended to provide insight into market trends and strategies, not to serve as actionable investment directives.
By using this platform, you acknowledge that you have read and understood this disclaimer and accept the associated risks of trading. Always trade responsibly and within your financial means.
Sources
- Bloomberg Terminal
- Reuters
- Investopedia
- Mckvay
- MarketWatch
- DailyForex
- MacroTrends
- Trading Economics
- Acuity Knowledge Partners
- Longforecast.com
- Cboe Global Markets
- TradingView
- Central Bank Websites
- World Gold Council
- Refinitiv Eikon
Straight To The Top.
Copyright © 2025 Mckvay. All rights reserved.
Terms And Conditions